The Future of Pulp & Paper Manufacturing

The pulp and paper industry is one of the largest industrial sectors in the world. Over the past two decades, it has experienced considerable change, including digital technology advancements, environmental factors, rising energy and labor costs, sustainability objectives, and more.

This post discusses these changes as well as their effects on the sector’s future prospects.

Digital Transformation for Pulp and Paper
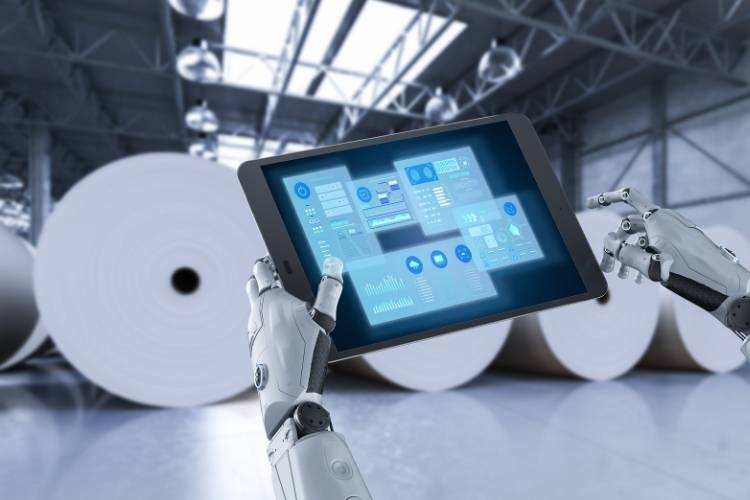
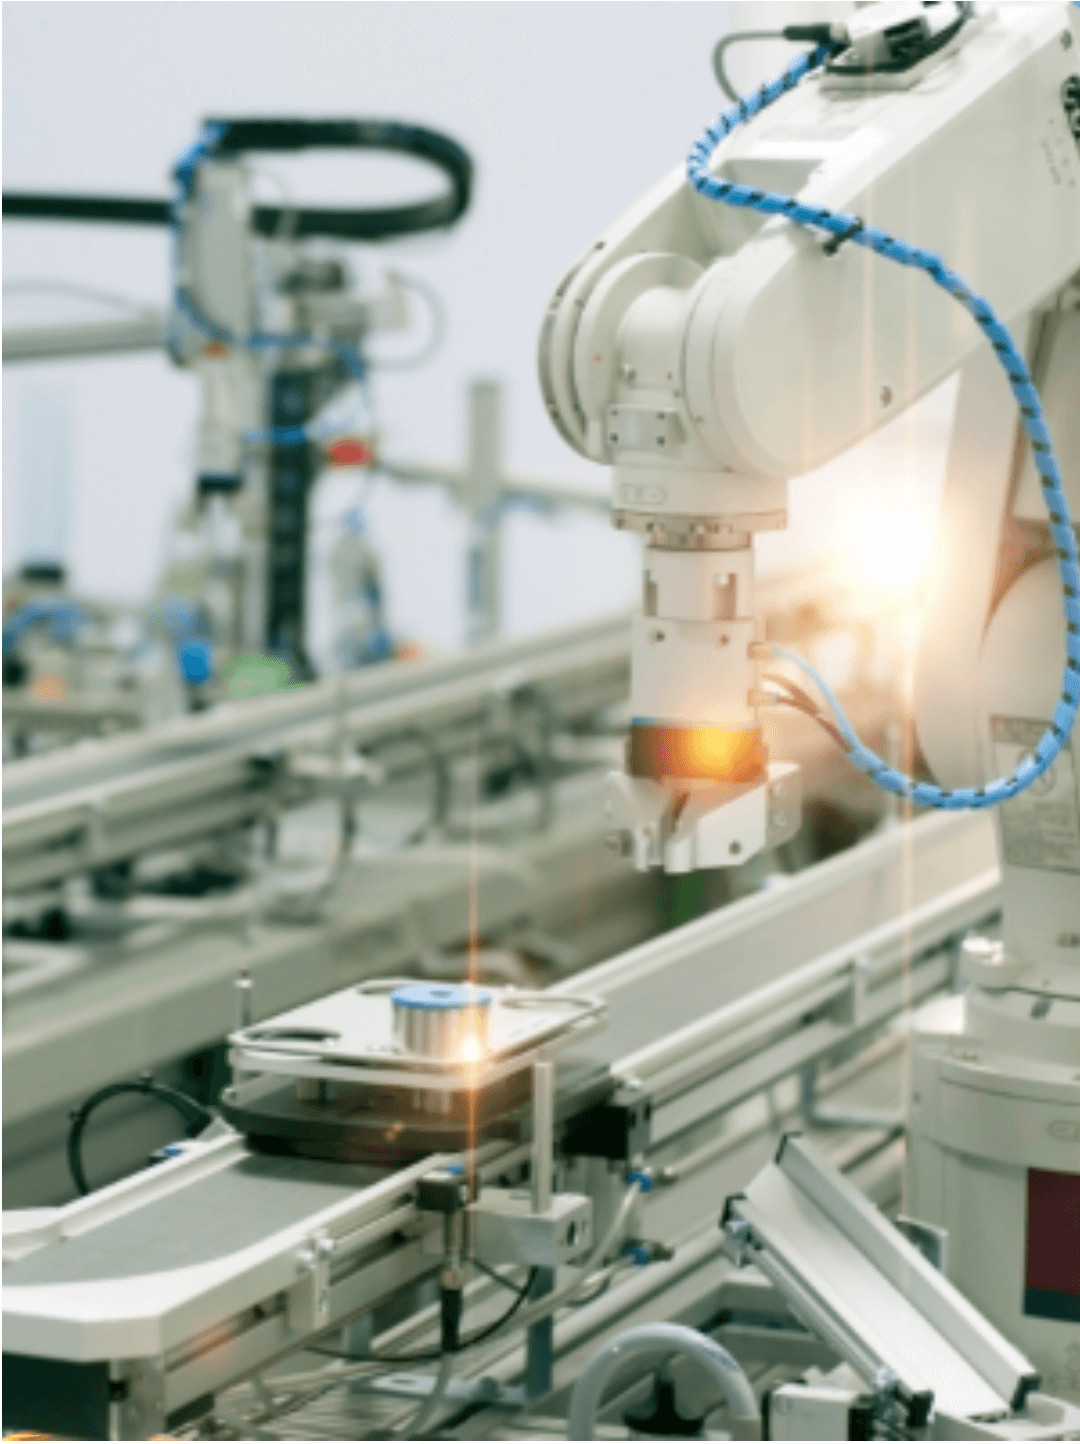
The pulp and paper industry has undergone several digital transformations, with mills adopting new technologies to improve efficiency and reduce their environmental impact. For instance, many mills have adopted smart sensors that monitor production processes and help optimize performance. 

Automation has also played a role in the industry’s modernization; some mills have replaced workers with robots to cut costs and improve safety.


In addition, many mills have adopted digital technologies to improve their communication with customers and suppliers. This has allowed them to streamline their operations and better meet the needs of their stakeholders.

Ultimately, the goal of these digital transformations is to make the pulp and paper industry more sustainable. By reducing energy consumption and emissions, mills can become more environmentally friendly and protect the natural resources that they rely on. By embracing new technologies, the pulp and paper industry can continue to thrive into the future.

Pulp and Paper Manufacturing: Rising Energy and Labor Costs

The pulp and paper industry has also been affected by rising energy costs. The cost of pulp, one of the largest expenses for mills, is highly sensitive to oil prices; when crude falls (as it did from 2014 through 2016), pulp prices tend to decrease as well.

Many mills have had trouble securing natural gas supplies on favorable terms due to the strong demand for this commodity in North America. As a result, firms’ prospects have diverged across regions and product segments.
Mills in Europe, China and India also face challenges with rising labor costs and increased competition from South Korean conglomerates known as chaebols. While these factors will likely hold Chinese pulp production back somewhat, India is expected to see strong growth in the coming years as it ramps up its own pulp manufacturing.

Sustainability in Pulp and Paper Manufacturing

Environmental factors have been another key driver of change in the pulp and paper sector. Mills are increasingly being forced to comply with stricter regulations governing emissions, effluents, and waste management.

The pulp and paper manufacturing industry is a vital part of the global economy, but it also has a significant environmental impact.

In order to be sustainable, the pulp and paper industry must reduce its environmental footprint while still meeting the needs of consumers and businesses.

In particular, concerns over climate change have led companies to seek ways to reduce their carbon footprint. This has included measures such as installing renewable energy sources at mills and investing in forest conservation initiatives.

There are several ways to make pulp and paper more sustainable. One way is to use recycled materials in the manufacturing process. Another way is to use energy-efficient equipment and processes. And finally, companies can work to reduce their overall environmental impact by implementing responsible management practices.

By making small changes, pulp and paper manufacturers can help ensure that this important industry remains environmentally friendly for years to come.

Smart Manufacturing and Autonomous Control for Pulp and Paper Manufacturing

Critical to optimizing the performance of plant operations and reducing quality variations in pulp and paper manufacturing is proactive and accurate process control. Smart technology is being adopted by the pulp, paper, and packaging industries; this digital transformation in manufacturing reduces the consumption of raw materials, and process variability, drives down costs, increases throughput, and gains a competitive edge with customers.

The ProcessMiner AI-enabled platform delivers process improvement recommendations and optimal control parameters in real-time to your pulp and paper production line. Through our predictive machine learning and artificial intelligence systems, online recommendations are sent for autonomous proactive control. Our platform ensures reductions in cost, scrap, and defects commonly encountered in pulp and paper manufacturing processes.

Learn how the ProcessMiner platform uses real-time artificial intelligence to help reduce energy consumption, raw materials, chemical usage and cost. See our quick “How it Works” video.
The Evolution and Required Transformation of Statistical Process Monitoring

In Industry 4.0, there is a need for automated diagnosis of process monitoring alarms along with root cause determination and process adjustment. Computationally intensive and adaptable approaches such as those incorporated into ProcessMiner software are required for these reasons.

Our readers are likely familiar with the industrial practice being broken down into the following four roughly defined eras: Industry 1.0 (use of water and steam power and mechanization starting about 1800), Industry 2.0 (use of electricity, mass production, and assembly lines starting about 1900), Industry 3.0 (use of automation and information technology starting about 1970) and now Industry 4.0 (use of cyber-physical control and big data starting about 2011). In addition to advances in technology, these eras of industrial practice could also be characterized in terms of increases in the availability and use of data.

Industry 2.0 and Statistical Process Monitoring

Statistical process monitoring (SPM) originated with Walter Shewhart’s work at Western Electric during the Industry 2.0 era. Shewhart was the first person to recognize that the time order of industrial data could be very informative. Data collection was slow, manual, and expensive in his day. Sampling frequencies were typically low. The first Shewhart chart in 1924, for example, involved a plot of proportions of non-conforming items with the data aggregated over months. Any calculations had to be simplified in order to be done by hand. The Shewhart control limits were set at plus and minus three standard deviations of the control chart statistic from the centerline. The Western Electric Handbook, which operationalized Shewhart’s ideas, was first published in 1956.

There were some major advances in SPM methods during Industry 2.0. Harold Hotelling introduced the first chart for monitoring multivariate data in 1947. S. W. Roberts introduced the exponentially weighted moving average (EWMA) chart in 1959 and E. S. Page introduced the cumulative sum (CUSUM) chart in 1961. These methods made better use of information in recent data. It does not seem, however, that the EWMA and CUSUM methods had much of an influence on industrial practice in this era.

Richard Freund of Kodak introduced the acceptance control chart in 1957. The purpose of his chart was to widen the Shewhart chart control limits to avoid the detection of process shifts that were considered to be too small to be of practical importance.

As another notable contribution, in 1959 J. E. Jackson proposed a multivariate monitoring method based on the use of principal components. It was much later, however, before the principal component methods could be used to their full potential.

Industry 3.0 and Statistical Process Monitoring

The quality revolution in the U.S. started around 1980, well into the Industry 3.0 era. The primary driving force behind the quality revolution was quality and price competition from Japanese companies. Statistical monitoring methods became widely used and in some cases oversold. W. E. Deming was the de facto spiritual leader of the quality revolution because much of the Japanese quality success was attributed to his teaching in Japan in 1950 and later. Deming was a strong proponent of process improvement by continual variation reduction. He also advocated the use of the Shewhart control chart, writing that no method of monitoring was better. In particular, he was opposed to the widening of the Shewhart three-sigma control limits.

As the amount of data increased during Industry 3.0, more and more SPM methods were developed. Computation became much less of an issue with software, such as Minitab® and JMP®, becoming available. There were additional multivariate methods introduced such as the multivariate EWMA chart and multivariate CUSUM charts. As sampling frequencies increased, it became important to account for autocorrelation in the data. Manufacturing processes are almost invariably multi-stage, so methods were developed to account for incoming quality, not just outgoing process quality, at each stage.

Methods were developed in Industry 3.0 for monitoring processes where there was more than just the one variance component assumed with Shewhart control charts. For example, with batch data, there could be variation between batches as well as variation within batches. There were extensions required for the monitoring of functional data (called profile monitoring), where quality is best characterized by a relationship between a response variable and one or more explanatory variables. One of the first applications of profile monitoring was developed at the U.S. National Bureau of Standards for monitoring calibration curves. Some methods were also developed for monitoring image and video data.

Industry 4.0 and Statistical Process Monitoring

Although standard Industry 2.0 and 3.0 statistical process monitoring methods can remain useful, they fail to work well, if at all, in many Industry 4.0 applications. Industry 4.0 data are often high-dimensional with high sampling frequencies. Control charts have been developed to signal for data that indicated a statistically significant process change. With massive amounts of data, any change, however small, becomes statistically significant. In an increasing number of cases, the focus needs to be on detecting, to the extent possible, only process changes of practical importance. In effect, control charts and warning systems, in general, need to be tuned to detect shifts of practical interest, which will vary by application.

Having a smoke alarm that is activated by the striking of a match would be very undesirable in a kitchen, for example, but such sensitivity might be desirable in an airplane lavatory. Thus, there needs to be a return to some of the basic ideas of Richard Freund and the acceptance control chart. The focus needs to be on the practical importance, not just the statistical significance, of process changes.

There are other complicating issues that can arise with Industry 4.0 data. The use of sensor technology leads to high dimensional data, so dimension reduction methods can be helpful to take advantage of the resulting duplication of information. The high sampling frequencies require decisions about the appropriate level of data aggregation. Sampling frequencies will rarely be synchronized for the measured variables, as assumed in Industry 3.0 multivariate methods. In particular, quality variables are often measured at much lower frequencies than process variables and are often characterized by delays such as those due to lab work.

The types of data in Industry 4.0 can vary as well with attribute data, variables data, profiles and image data all required for decision making. In addition, there can be complicated relationships between variables involving correlation and causation.

The data involved in Industry 4.0 applications can be far too complicated to be handled by traditional statistical process monitoring approaches. Modeling and using the process data effectively, even by process experts, is often impossible. In Industry 4.0 there is a need for automated diagnosis of process monitoring alarms along with root cause determination and process adjustment. Computationally intensive and adaptable approaches such as those incorporated into ProcessMiner software are required for these reasons.

Tom Tulloch ProcessMiner

Bill Woodall

Scientific Advisor, ProcessMiner, Inc.

Bill is Professor Emeritus in the Department of Statistics at Virginia Tech. He has been active in the quality monitoring and improvement area for nearly forty years. He has published many papers on Industry 3.0 monitoring methods and some on Industry 4.0 applications. A full list of his papers can be found at www.stat.vt.edu/people/stat-faculty/woodall-bill.html. Papers are available upon request.

Email: bwoodall@vt.edu.

Three Common Misconceptions About AI in Manufacturing

Artificial intelligence (AI) and machine learning (ML) are creating quite a name for themselves in the manufacturing industry and for good reason. Both AI and ML are helping manufacturers use factory data to streamline operations, improve processes and make better business decisions.

But what’s the difference between artificial intelligence and machine learning?

Simply put, artificial intelligence is machine-generated intelligence that leverages concepts and tools from multiple fields, including computer science, cognitive science, linguistics, psychology, neuroscience and mathematics. Machine learning is a type of AI where machines absorb data and learn faster and more accurately than humans can.

Misconceptions About AI and ML in Manufacturing

Let’s look at the difference between Conventional AI and Intelligent AI and why using the proper tools is essential for successful overall equipment effectiveness (OEE) and improvements in manufacturing operations.

Many manufacturing operations are investing in AI for operational improvements. This article is designed to help dispel some common misconceptions about AI and speak to the many benefits early adopters of AI achieve.

Using the right tools for the right jobs helps manufacturers achieve success faster and deliver high ROI through early adoption.

AI and ML Misconception # 1: AI and ML are the same.

Artificial intelligence is a toolbox, and for a company looking to apply AI to digital transformation, it’s important to understand the distinction and benefits that can be achieved by each one.

Thinking about the tools a carpenter uses to build a house will help you understand “the right tools” for the job at hand. If a carpenter is going to build a house, they need multiple tools to be successful. For example, her raw materials might include plywood, shingles, nails, framing, metal flashing, etc.

The same ideas apply to AI. Depending on the job at hand and what you are manufacturing, you require the right AI tools for the job. Below are some examples of AI tools that can be deployed in manufacturing operations to help improve OEE in the categories of availability, performance and quality!

Without the proper skill sets and process domain knowledge for a particular industry, it won’t matter what tools are used or what data is accessed. To be successful, you need a combination of both.

Conventional AI vs. Intelligent AI

Let’s look at the difference between Intelligent AI and Conventional AI and why using the proper tools is important for successful OEE improvements in manufacturing operations.

AI has become a buzzword that has lost much of its meaning due to common misconceptions. To simplify, consider the following two categories of AI and definitions with examples to help distinguish the difference between both:

  • Conventional AI is a collection of technologies (tools) that use algorithms to programmatically simulate specific tasks often performed by human beings. This form of AI uses automated formulaic sequencing logic for problem-solving but doesn’t typically involve machine learning. Instead, these technologies focus on solving problems in which the behavior patterns can be laid as formulas.
  • Intelligent AI is engineered to learn and adapt to variability in processes, surpassing human intelligence for improved decision-making purposes. Intelligent AI is more advanced than Conventional AI because the algorithms learn and make better decisions as more data is consumed. In addition, because these technologies operate at incredible speed and accuracy rates, intelligent AI is much more advanced than Conventional AI when applied to complex manufacturing processes.

Many AI companies use Conventional AI for improved business intelligence (BI) purposes, but this requires a process engineer or operator to validate and act on the outcomes consumed through dashboards and reports. We call this reactive process control. It’s useful for things like root cause analysis but offers limited value for continuous manufacturing. Intelligent AI enables machines to quickly make highly accurate decisions so that parameter control changes can be applied automatically to continuous manufacturing environments without human intervention. This is often referred to as proactive process control or autonomous manufacturing.

With the Intelligent AI toolset, multitudes of machine learning techniques are applied depending on the task at hand. For example, building a roof and installing plumbing require different tools. In addition, machine learning improves manufacturing outcomes by combining powerful AI technology such as supervised and unsupervised reinforcement and deep learning systems.

Supervised machine learning algorithms use labeled data sets, beginning with understanding how the data is classified. Unsupervised models use unlabeled data sets and can figure out patterns and features from the data without preexisting categorization or explicit instructions. Reinforcement learning, on the other hand, uses an iterative approach.

Instead of being trained by a single data set, the system learns through trial and error and receives feedback from data analysis. With the power of faster data availability (real-time and streaming) and big data computational capabilities, deep learning applies specific “neural networks” algorithms. Neural networks are composed of decision nodes that more accurately train ML systems for unsupervised, supervised, and reinforcement learning tasks.

One way to think about the difference between Conventional AI and Intelligent AI is the hammer and nail vs. the nail gun. But, of course, both technologies can add value to a manufacturing operation. Still, if your goal is to accelerate OEE or improve product quality automatically, Intelligent AI will get you measurable results much faster.

How can the more sophisticated Intelligent AI tools help improve your operations?

Using power tools helps get the job done faster and with greater precision than manual tools. When it comes to cutting the plywood used for a roof would you choose a hacksaw or an electric-powered circular saw?

Intelligent AI can identify variability in complex manufacturing operations that either happens within tight production cycles or at very high rates of speed.

These require split-second decision-making followed by accurate recalibration recommendations and instantaneous parameter control setting changes.

Suppose your manufacturing operation is continuous and is highly sensitive to changes in machine conditions (i.e., temperature, pressure, machine speed and set-point accuracy). In this case, Intelligent AI is better suited for delivering proactive process control to your operations than Conventional AI.

If you are automating a task performed manually that doesn’t require a sophisticated machine learning model to perform, then Conventional AI may be a better fit.

AI and ML Misconception #2: AI is a proven technology that solves all complex manufacturing problems.

Conventional AI, which can be viewed as the manual tool in the toolbox (hammer), won’t be the end-all solution for solving your particular manufacturing complexities. AI models, just like the human brain, require education and training before they become proficient at problem-solving. Fortunately, Intelligent AI uses machine learning that ingests data more rapidly. As a result, its accuracy improves over time as more data gets processed and different conditions are encountered for training and retraining the models. In addition, measurable process improvement is achieved by applying the prescriptive parameter control setting changes in real-time.

Again, this is about using the right tools for the task at hand. If your primary objective is to improve product quality, then Intelligent AI, when applied, will get the job done faster and more precisely. But, just as a first-year medical student would be ill-prepared to perform brain surgery after taking his first anatomy course, even Intelligent AI requires thorough training by ingesting high volumes of data before it learns to apply the suitable model for the right conditions based on what the data is revealing. This includes some experimentation and repetitive model training before delivering accurate and automatic continuous quality improvement in many cases.

There will always be certain tasks and processes that are best left to humans to perform, especially those requiring human senses like taste and smell. However, even those categories are being explored by leading data scientists – stay tuned.

Without the proper skill sets and process domain knowledge for a particular industry, it won’t matter what tools are used or what data is accessed. To be successful, you need a combination of both.

AI and ML Misconception #3: AI can be used indiscriminately to solve any complex manufacturing problem.

If an AI company tells you, “just give me all your data, and our AI will solve your problems,” my advice is to run away as quickly as possible! Many AI companies fail to recognize just how complex and variable manufacturing conditions can be from production line to production line and from machine to machine.

The first step toward solving these complexities is acknowledging the underlying causes and using subject matter expertise and knowledge to address the issues. Understand that it’s not just “the data ” you must understand how the process works. Having SME inputs and incorporating them in your AI configurations is critical to success.

Furthermore, if your approach is to process “all the data” vs. “all the right data,” then your AI will struggle to decipher which data is essential and what process parameters are most closely associated with OEE improvements.

The “all the data” approach introduces noisy data into a process likely to deliver garbage results.

A wrench is useful when installing new plumbing in your bathroom, and hiring a plumber to help with the installation is a sound idea. However, hiring a plumber to build your roof with a wrench is a bad idea.

The point is that without an intimate level of domain expertise for your line of work, it won’t matter what tools you use or what data you access because you still need the proper skill sets and process domain knowledge to be successful.

Early Adopter OEE Benefits and Sustainability Gains with Applied Intelligence

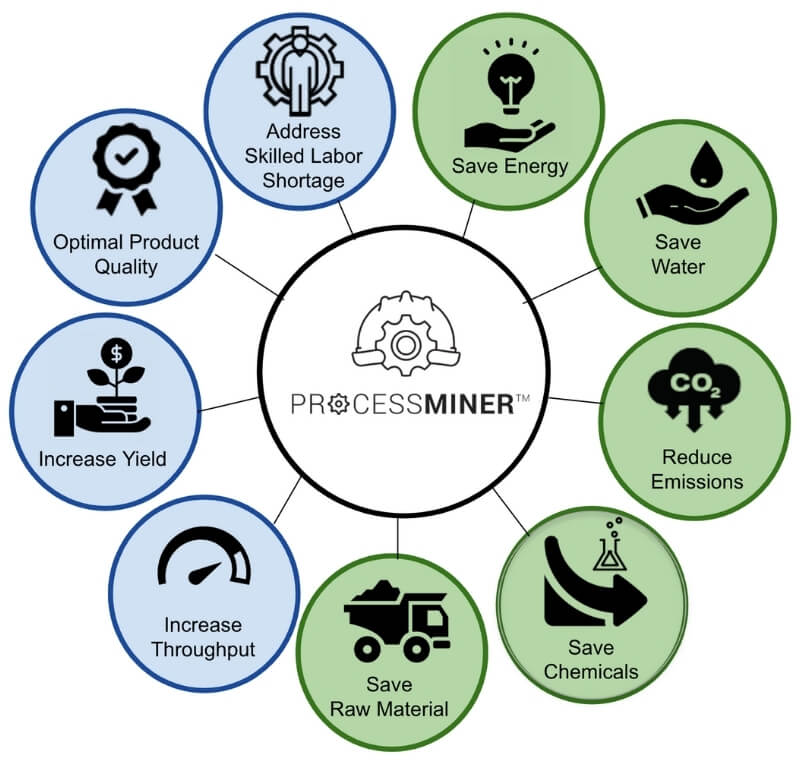
Benefits early adopters can expect to achieve using AI-powered Applied Intelligence for their manufacturing operations:

Operational Improvement

  • Address Skilled Labor Shortage
  • Improve Product Quality
  • Increase Yield
  • Increase Throughput

Sustainability Improvement

  • Save Energy
  • Reduce Emissions
  • Reduce Chemicals Usage
  • Save Raw Materials
  • Decrease Water Usage

Tips on How to Get Started on an AI Project at Your Organization

Some manufacturers don’t want to bother with a complete overhaul of their manufacturing processes. Instead, the key to successful AI-powered manufacturing is early adoption. Tips for achieving early adopter success with artificial intelligence include:

  • Identify which aspects of OEE improvement are most important to your operations and force rank them:
    – Availability
    – Performance
    – Quality
  • Inventory your data and determine what data attributes are required for success:
    – What data sources do you have access to
    – Work with Process Engineers to find the “right data.”
    – At what frequency can data be accessed
    – Is the data tagged and categorized and time-stamped?
    – Is there data missing that is necessary to achieve the desired OEE improvements
  • Identify an aspect of your manufacturing process that often fails or processes that fall over and choose one, start small, build to scale, and move rapidly.
  • Work with the right AI tools appropriate for the job or task at hand – find an expert.
  • Experiment, test, refine results and automate what can be automated, then move on to the next problem to be solved.
  • Measure results, expand adoption, and scale across operations, then take credit for the wisdom and ROI you’ve delivered for your company.

Manufacturing’s Perfect Storm

US Manufacturing Supply Chain Unprepared for Record Surge in Demand

By: Tom Tulloch, Chief Commercial Officer, ProcessMiner™

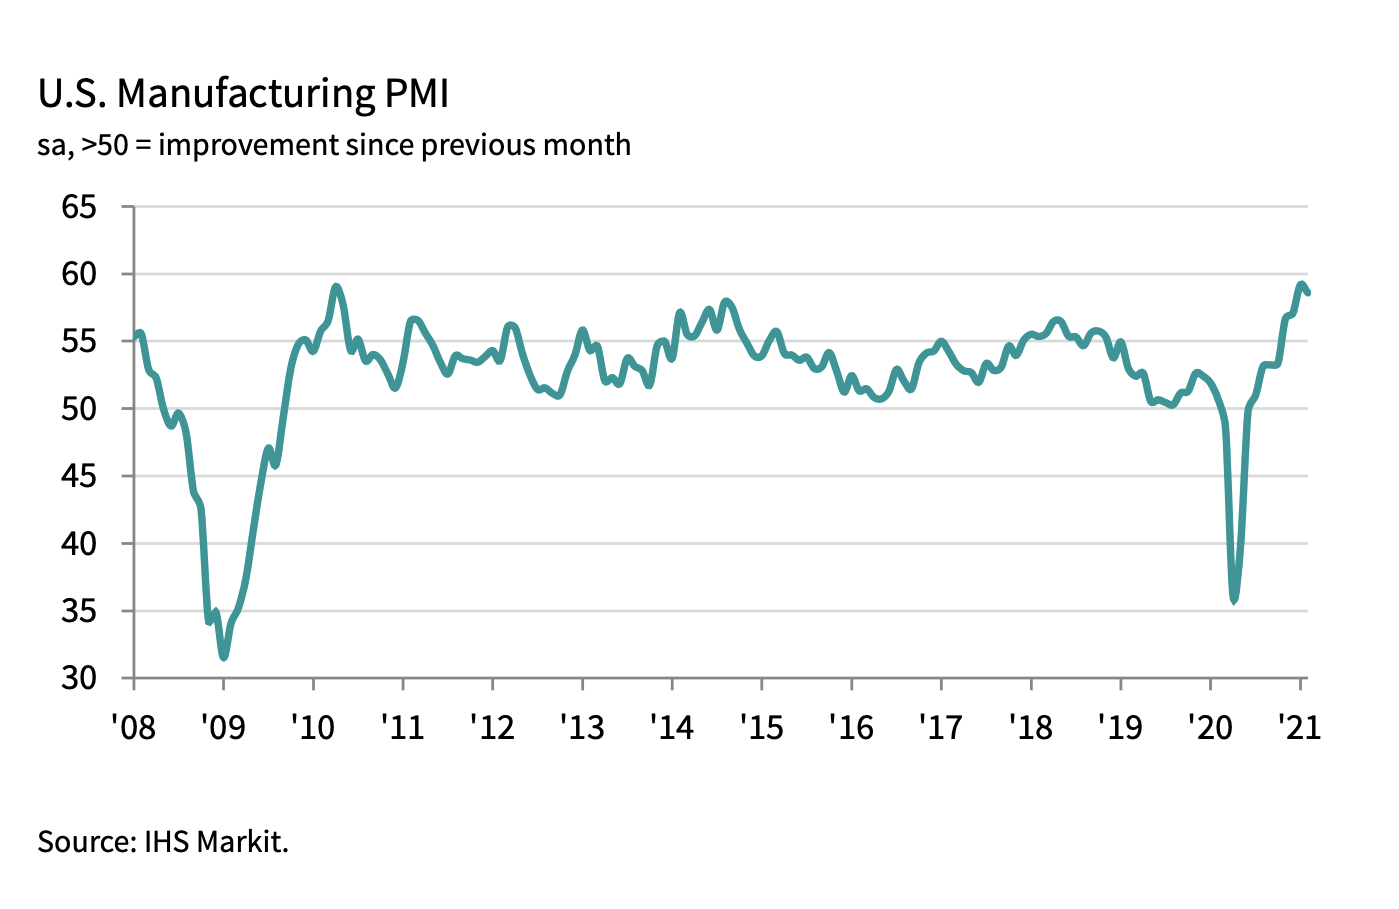
Manufacturing is forecast to come roaring back in the second half of 2021, according to many leading indices. This is fantastic news for the US economy but poses significant challenges for the manufacturing sector due to unique complications brought on by the COVID-19 pandemic and resulting supply chain disruptions.

According to the IHS Markit and the Institute for Supply Management‘s activity data for February, both Purchasing Manager Index (PMI) readings registered at around 60.0, the second-highest readings in more than a decade (anything above 50.0 signals growth).

Add to this the US ISM Manufacturing Prices Paid Index surging to 86, its highest level in 17 years, and you have the makings of a “Manufacturing Perfect Storm.”

Great news for manufacturing, right?  Good problem to have, yes?  

Not so fast.

Unfortunately, many businesses are ill-prepared to keep pace with this forecasted V-shaped recovery. According to the IHS pricing index, US manufacturers are facing unprecedented cost pressure due to price increases in raw materials, rising fuel costs and inflationary pressure, which is likely to corner manufacturers into price increase challenges.

The other problem is the growing backlogs of new orders brought on by reduced operational capacity and new standard operating procedures (safety protocols) forced into manufacturing operations as a result of the COVID-19 pandemic.

Who will the winners and losers be in this “perfect storm?”

That depends.

For many manufacturers, innovation and ingenuity may help save the day, and the demand surge will lead to growth metrics that any wall street analyst or investor would celebrate. The mountain gets a bit steeper to climb for others who haven’t kept pace with Industry 4.0, SMART factory digital transformations.

The moral of the story is a much-deserved congratulations to the risk-takers and bold innovators who embraced Industry 4.0 technologies early on. Your early adopter status improves your odds of “making it rain” in this storm and it’s highly likely you will outperform your competitors who took a wait-and-see strategy.  Why?  Because you are now reaping many of the benefits brought about by connected factories, including:

  • Improved productivity
  • Better safety records
  • Lower scrap and waste
  • More efficient use of energy
  • Better product quality
  • Less downtime and higher OEE
  • Improved decision making

For those out there who are still on the fence, it’s not too late to get in the game and make those investments now. Perhaps you will survive this storm, but now is the time to reconsider your strategy and prepare for the next crisis looming just around the bend.

Bringing Industry 4.0 to You

For most of us, the building years of our lives were shaped by the books we read. A generation acquired its knowledge caressing through dry books with stenciled alphabets. From learning our ABCs to Shakespeare’s sonnets, Industrial Revolution ensured that its role in shaping world history through its machinery, chemicals, steam and more, is kept alive and documented via its own production of printing machines.

The Industrial Revolution paved the way for the life we know today and far surpassed the era of simplistic conveyor belts and heavy manual surveillance. Production lines employ machinery and humans alike. Industries have always stepped up with technological advancement and thereby use a plethora of devices designed and produced to meet specific tasks on factory grounds. Now is an era of warehouse robotics and sensors which not only aid in increasing manufacturing throughput but also capture different types of data, in every step of the production.

Over the years, technological advancement has mostly been through digitization, and while it gradually dropped its ones and zeros, computations became faster, devices shrunk, and we entered an era when a human trait like intelligence can also be synthesized artificially. With quintillion bytes of data generated every day, it became crucial to understand and track the data that matters, and it gradually led to the emergence of data science to look for patterns and meanings.

How can present-day industries step up with such digital advancements and thrive on it?

Say Hello to Industry 4.0

The ever-growing demand, supply-chain functioning and pressure to ensure timely deliveries keep manufacturing industries on their toes. Hence, it is essential that every process of the production cycle contributes to minimum loss, maximized production, and function like clockwork.

Most industries are already equipped with devices and sensors which, apart from functioning for which they are built also capture and send data from one unit to another. Industry 4.0 uses an existing framework of these networks of devices and sensors and gives then an AI advantage.

It uses the principles of digital automation and data exchange to make manufacturing factories function smartly. Referred now as the fourth manufacturing revolution, Industry 4.0 is the next generation of computerization which not only lets devices communicate but also provides real-time monitoring and thereby optimization.

With ProcessMiner, industries can onboard this change with ease. The SaaS-based platform picks relevant data from the start of the process to the end-quality product employs machine learning techniques to train models based on the data received and figure out the complex but relevant relationships between quality parameters. After this slow and steady phase, the customer’s dashboard is ready for easy to grasp information and charts in real-time. Moreover, the models are adaptive and evolve as per the changes done in factories. With a trained model in place, customers get recommendations based on the real-time data in their respective dashboards.

Let’s look this up in detail with an industrial case study.

Empowering Paper Industry via Real-time Predictions and Recommendations

From pulp to high-quality packaging paper, paper industries use numerous sensors across the manufacturing unit which capture real-time data every 15–30 seconds. The end goal is to ensure that paper quality, often measured in terms of their strength parameters like Mullen, STFI or Ring Crush is intact while ensuring the least usage of raw materials and generate maximum paper reels.

The platform captures relevant data from sensors during the process, and of finished quality paper of a particular grade. This process is repeated for as many grades of paper as defined by the customers and the AI model is continuously trained. Our customers define the strength parameters relevant for a particular grade of paper prior to model training and the process is then repeated for multiple grades. The model takes in data and mines for underlying complex relationships across various process data that contribute to paper quality, thereby creating a model that is not over-simplistic and hence more accurate with predictions.

All the needed data like strength parameter, paper grade, paper reel throughput is available on the customer dashboard. Over time, the model learns and defines “target ranges” for variables like Mullen/STFI/Ring Crush, raw materials weight, etc. These target ranges are the learned optimal values at which the paper production was the highest with minimum loss.

The quality of the paper reel produced is paramount in the whole process. A trained AI model in place takes real-time sensor data and makes predictions for strength and variable parameters that are bound to paper reel quality. Further, if the quality parameters deviate from their ideal values, the AI model also makes recommendations to bring them back to their desired limits.

Benefits of ProcessMiner’s Industry 4.0 Platform

  1. Tailor-made for your manufacturing type: Each factory is unique in its own design of production line and sensor placements. Our dashboard is designed to reflect the numbers that are relevant to the type of factory and its relevant data.
  2. Adaptability: Manufacturing industries undergo constant changes that can range from a change of raw materials to the degradation of machine parts. As a result, the trained models from older sensors run the risk of being irrelevant for real-time predictions and recommendations. ProcessMiner’s platform has identified this hurdle and hence designed the AI model to be self-adaptable with new sensor data. Over time, data from old sensors become obsolete and the model trains itself with new data.
  3. Accuracy: The model under training is fed with different kinds of data from different sensors across the process and in different types. As such, the data dimensionality is complex and hence difficult to find relationships between process parameters that matter. Our platform leaves no data unturned that can lead to the end goal — more paper, less waste. This complexity makes predictions super reliable and accurate.
  4. Informed decision making: ProcessMiner’s dashboard narrows down the complex and computation heavy processing of data to give relevant information related to the paper reel quality. The additional mechanism of real-time predictions and recommendations to maintain paper reel quality lets our customers make data-driven decisions.

Industries are evolving. The AI drift in digitization is here. With superior digital technological growth in place, it is a matter of time that industries would plug this growth and use it to manufacture goods more meaningfully. With access to a handy, real-time dashboard, and intelligent information, industries can thrive with reduced costs, reduced waste of raw materials, and maximized production outputs.

Originally posted on Medium.

Variability Reduction: Why Important To Manufacturers?

A routine issue faced by most manufacturers is their process variation. Variability in the process can wreak havoc on product quality and customer satisfaction. Also, it has a severe impact on revenue, cost, and margins.

In the highly competitive manufacturing market, the champion (industry) will be the one who has a strategy to mitigate this variability.

Focus on Variability Reduction Strategy

Variability in the manufacturing process is the difference between the produced quality measure and its target. High variability leads to either waste or excess production costs.

Unfortunately, due to their stochastic nature, the process variability in manufacturing systems is unavoidable.

But it is controllable and with the right strategy, can be minimized.

For example, think of paper manufacturing. An important paper quality measure is thickness. Due to high process variability (as shown in Figure 1), sometimes the thickness quality is less than the lower specification limit determined by the customer — resulting in a loss of sales.

To avoid the loss, operators often overfeed the machine with more wood fiber. This pushes the process mean upwards resulting in higher production quality (see Figure 2).

However, this strategy is extremely costly due to the overconsumption of raw materials. Therefore, the right strategy is to reduce process variability. As shown in Figure 3 below, reducing the variability reduces the out-of-limit instances. It further allows us to tighten the production target range (product specification limits) to further save material cost, waste production, and increase the throughput.

However, the major challenge in reducing process variability is an operator’s inability to measure the product quality at all times. Most manufacturers perform quality tests at the end of the production cycle time or in long-time intervals (e.g. 45 mins or more in the mills we have worked at). In paper mills, the operator takes a sample from a reel of paper at its completion and then proceeds to test it in a lab while the manufacturing process continues. Following this, based on the lab results, the operator makes changes in the process accordingly. However, if the quality test fails, we have then already lost a batch of product.

This lag in the lab results can be very frustrating, which results in both an issue and an opportunity for all manufacturers. Why? Because the results from the lab tests are used to adjust the process settings. The subsequent adjustments assume that all variables involved in the process will remain constant and consistent with the variables recorded at the time of the test. However, the reality is that most of them, for example, speed and temperature, will most likely change.

This causes the operator to either always chase changes in the quality variables by making continual adjustments in the dark, or to set the controls to a certain “recipe card” and wait for the next lab test. There must be a better way to manage this process. Viewing the reel of the paper example above as an opportunity can help us address the lag issue with a new, different, and more effective process.


Below are a few questions worth considering:

  1. What if the quality could be predicted every 30 seconds instead of every 45 minutes or more?
  2. What if process variables like speed, temperature, raw material, etc. are incorporated into providing real-time predictions on the product quality?
  3. What if real-time recommendations are sent to operators and production supervisors to achieve quality targets and reduced variability? What if it leads to a closed-loop?

Today, companies with Industry 4.0 technologies, like ProcessMiner Inc. in Atlanta, Georgia, are working with manufacturers to layer their real-time predictive analytics and AI solutions on top of complex manufacturing processes to reduce variability, increase profit margins, and improve customer satisfaction.


The results are staggering but how does it work?

In most cases, ProcessMiner can utilize existing sensor technology and historian architectures to drive data to their secure cloud-based analytics platform. This means no development or hardware changes for the manufacturer. Additionally, ProcessMiner brings industry expertise to the manufacturers’ process. With this platform, there is no need to hire additional data scientists and process engineers for deployment.

The ProcessMiner solution is constantly ingesting data to deliver clear quality predictions coupled with real-time recommendations on process changes. This ensures production quality is consistently delivered, and variability is reduced through a comprehensive yet easy-to-understand user interface that delivers timely data to both the operator and supervisor.

You might be asking“Could the ProcessMiner solution work for our manufacturing process?” The simple answer is, “Yes, most likely it will.”


Questions to consider when looking at a real-time predictive analytic solution:

  1. Do you have quality measures clearly defined and are there existing sensors that collect data along with your manufacturing process?
  2. Are you unsatisfied with your ability to meet those quality standards?
  3. Is there a financial impact on your organization if quality measures are not consistently met? Have you determined what that financial impact is?
  4. Have you encountered barriers in developing or researching a machine learning/predictive analytics/AI solution?
  5. Have you invested in “predictive maintenance,” and looking for a solution that predicts and improves quality?

If your answers to any or most of these questions are yes, your team may benefit from ProcessMiner’s advanced AI to reduce variability in your production processes.

Originally posted on Medium.