Quality
Cut quality variability by up to 20% in specific deployments — without adding headcount. Quality predictions every 30 seconds, grade/SKU-specific limits.


Most unplanned stops start as slow quality drift that nobody sees until a lab result finally makes it obvious. ProcessMiner holds quality inside its limits continuously, so the conditions that lead to a stop never get the chance to build.
Why lines stop
A break or an off-spec run is usually the last step in a chain: a process variable wanders, quality trends toward its limit, and the deviation goes unnoticed until the lab, or the line itself, reports it. Keeping throughput up isn't about predicting the stop. It's about maintaining quality continuously so the conditions that produce one don't accumulate.
Quality drifts between lab samples. The problem announces itself.
Quality is predicted every 30 seconds and held inside its limits.
How the platform delivers it
Throughput isn't a separate feature. It's the result of holding quality inside its limits, continuously, across every grade/SKU you run. Three parts of the platform do that work together.
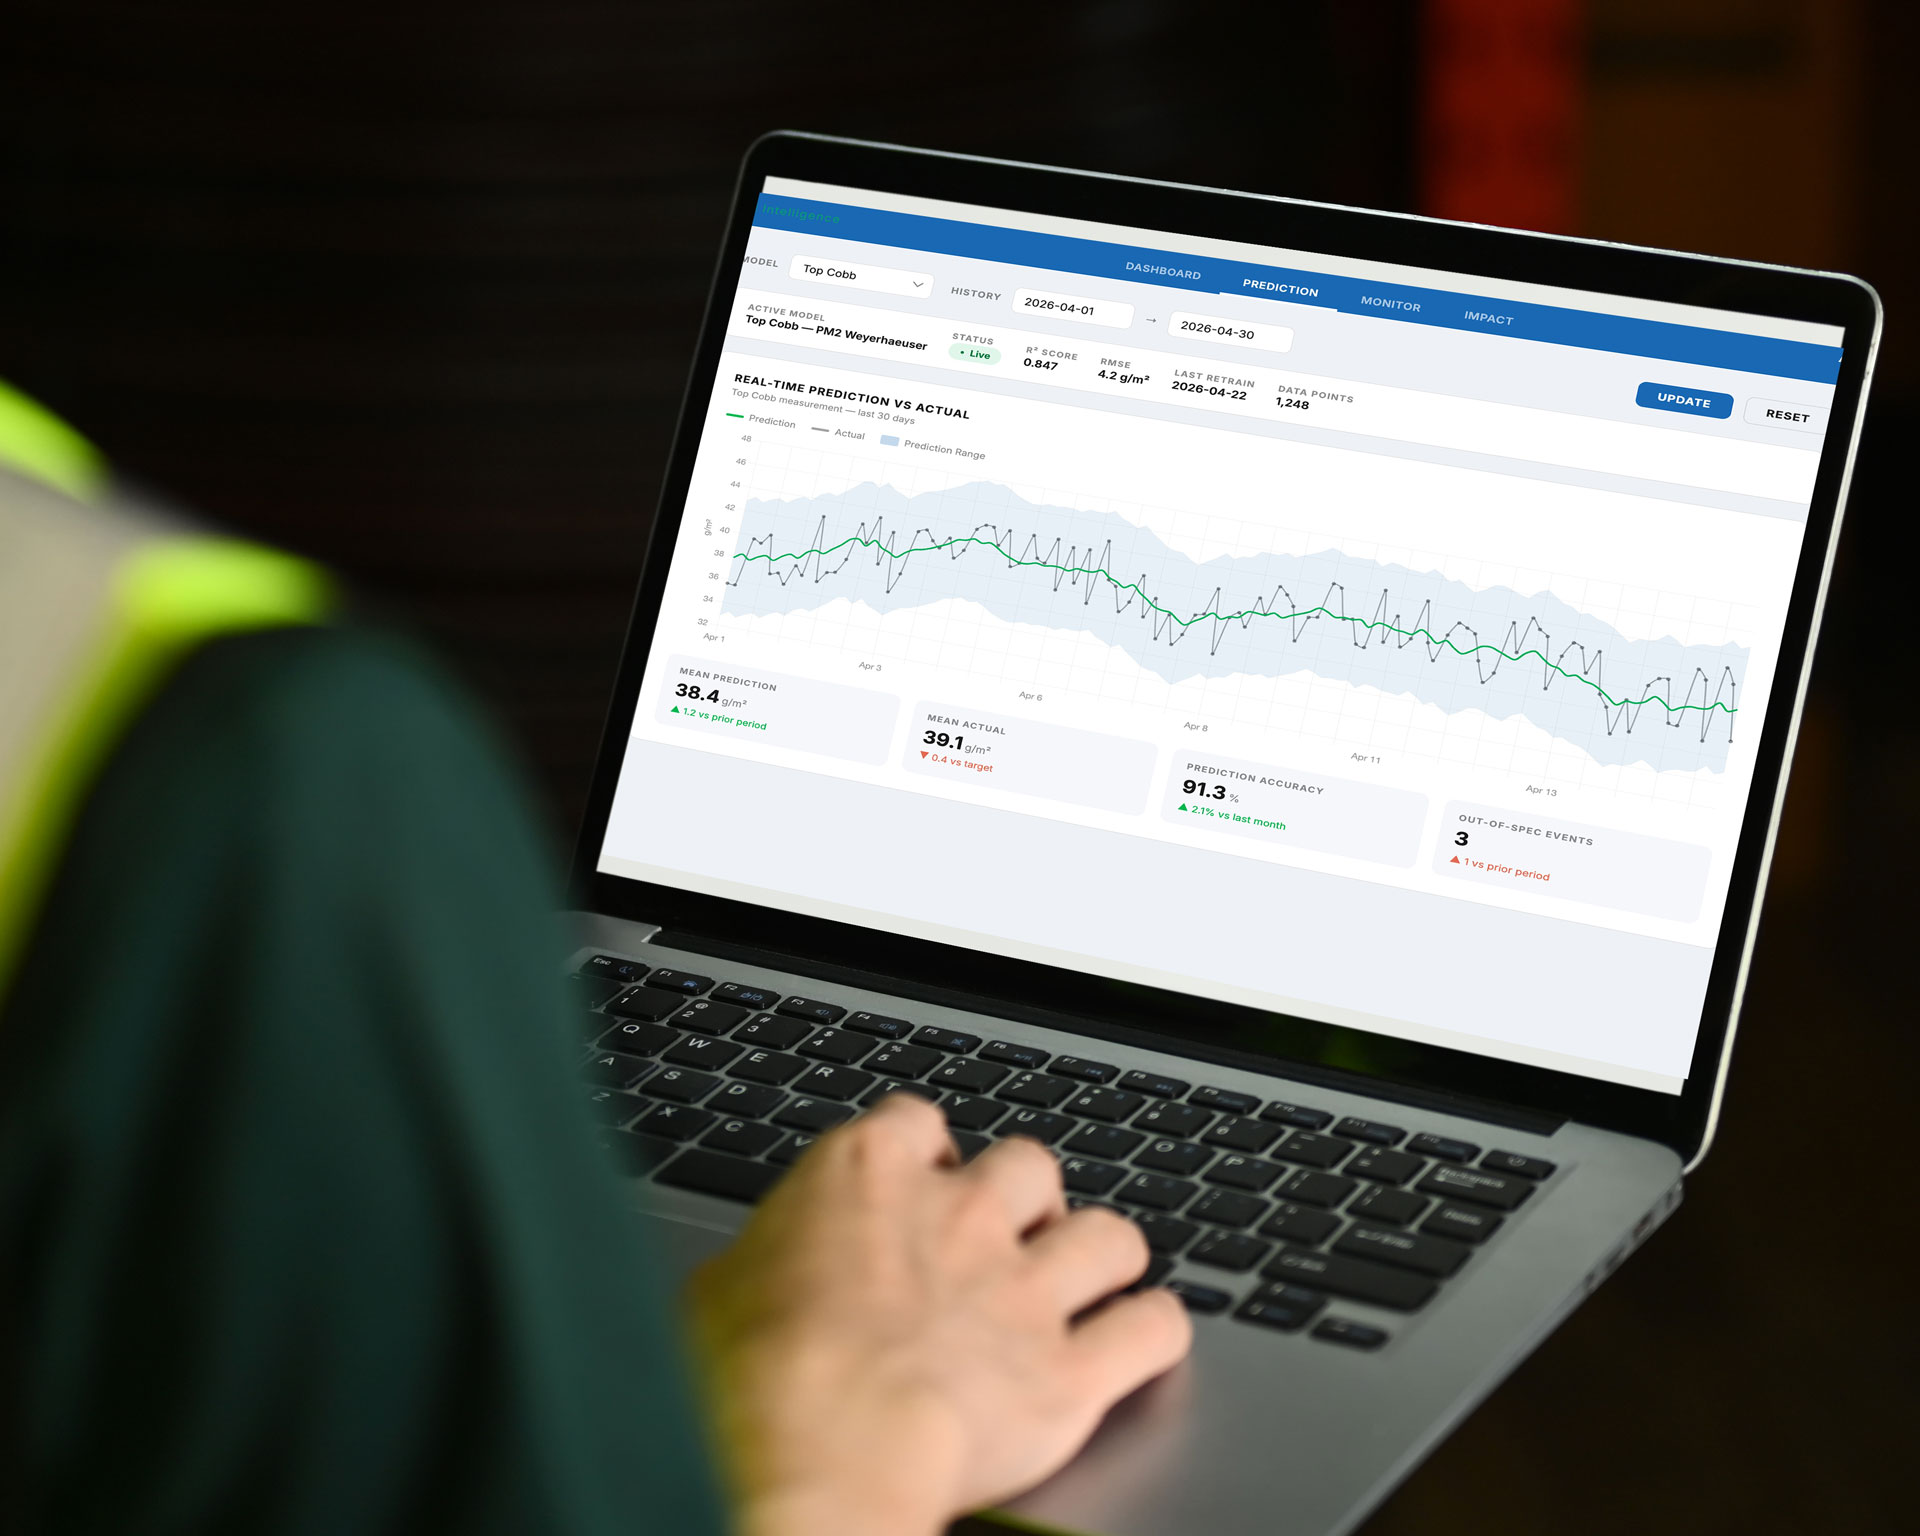
The platform predicts quality every 30 seconds, grade by grade, filling the blind spot between lab samples with a live trend. Your team sees where quality is heading, not where it was an hour ago.
Live quality trend
Chasing the cause of a deviation is where hours of throughput go. When a prediction crosses a grade limit, the platform surfaces the top 10–15 influencing process tags, ranked by influence, so operators fix the right variable the first time instead of experimenting on a running line.
Ranked contributing factors
Every machine has runs where everything held: quality on target, no surprises, full output. Centerlining captures those golden run conditions and keeps key process variables aligned to them in real time, so the process stays in the zone where stops do not happen.
Golden run alignment
What throughput is worth
Every hour of unplanned stop is a six-figure event on a paper machine, and even a fraction of a percent of quality improvement is worth hundreds of thousands per year. Small, continuous corrections compound.
Figures reflect actual ProcessMiner deployments in pulp and paper and published industry benchmarks. Results vary by facility, process, and data quality; past performance is not a guarantee of future results.
Prove it on your data
We'll walk through how the platform would hold quality on your grades/SKUs, connect to your historian, and quantify what fewer stops are worth on your machines.
Already seen the platform in action? If you're ready to start a pilot, click below.
Get in touch
Whether it's our platform, your process, or a free in-depth process data analysis and pilot you'd like to see in action, let us know.