Fixed rates, variable demand
Blowers, pumps, and drives are often run at fixed rates set for the worst case. The process rarely needs the worst case, so the margin is burned as energy, every hour of every shift.


Most plants treat energy as a fixed cost of running. It isn't. When the platform holds your process at its most efficient operating point, energy per ton produced comes down the same way variability does: continuously, measurably, without new capital equipment. The same discipline that lowers your energy bill also lowers what you report on emissions and resource use, one operational change, two outcomes.
Where the energy goes
Every time a process drifts off its best operating point, something compensates: more air, more steam, more pumping, more reprocessing. In industrial wastewater, aeration alone consumes more than 50% of a plant's energy budget. The waste isn't a single failure. It's the running cost of operating away from the setpoints your own best runs already proved out. Increasingly, that waste shows up on two different desks: the plant controller's energy line item, and the sustainability team's emissions inventory.
Blowers, pumps, and drives are often run at fixed rates set for the worst case. The process rarely needs the worst case, so the margin is burned as energy, every hour of every shift.
An off-center process needs more energy to make the same on-spec product. Off-spec product needs energy twice: once to make it, once to rework or replace it.
Operators are running quality and throughput. Re-optimizing setpoints for energy every 15 minutes is not a job a person can do on top of that. It's a job for the AI platform.
Fixed-rate vs. demand-driven
The platform learns what your process looks like on its best runs, then holds key variables at those golden-run targets in real time. Energy use follows what the process actually needs, not a rate someone set months ago.
Equipment runs flat-out so nobody gets caught short. Demand varies. The rate doesn't.
Setpoints track golden-run targets in real time, so supply follows actual demand.
Proof case / Industrial wastewater
Industrial wastewater is the clearest test of energy as a controllable variable. Aeration consumes more than 50% of a wastewater plant's energy budget, and blowers are commonly run at fixed rates regardless of actual biological demand. In a ProcessMiner wastewater deployment, holding the process at its efficient operating point improved sludge cake dryness from 13% to 20%, which means less water hauled, dried, and disposed of downstream. The same discipline that improved dryness governs aeration: supply what the process needs, when it needs it.
See quality drift as it starts, not after the lab confirms it. Hold the process closer to target, run after run, so quality stays consistent instead of swinging between the guardrails.
Improve quality, cut chemistry and energy waste, and lift throughput — the outcomes that show up on the bottom line. ProcessMiner turns your process data into the specific moves that get you there.
You know your equipment and your product. ProcessMiner brings the process intelligence and puts it directly in your operators' hands — no coding, no rip-and-replace. Speed to value, built on the knowledge your team already has.
Sustainability, not a separate initiative
Manufacturers increasingly have to report on energy intensity and resource use, not just cost. ProcessMiner doesn't require a separate sustainability program to do that. The same centerlining and prediction that hold quality also hold energy, water, and chemistry closer to what the process actually needs, so the numbers that go into an ESG report move in the same direction as the numbers that go into a P&L.
Energy per ton falls with variability, not through new equipment or a capital project.
In wastewater, better-controlled dosing and the dryness improvement already measured (13% to 20%) mean less material hauled, treated, and disposed of.
The same historian connection and models that report operational KPIs can supply the energy and resource figures a sustainability report asks for, instead of a parallel manual data-collection effort.
How the platform gets there
Energy efficiency isn't a separate module. It's what falls out when quality prediction, centerlining, and optimization keep the process where it runs best.
Your best runs already exist in your historian. Centerlining identifies the golden-run targets behind them and aligns key process variables to those targets in real time, on a live radar-style dashboard, so the process stops paying the energy premium of running off-center.
Golden-run centerlining
Quality predictions refresh every 30 seconds, so the platform sees the process leaving its efficient operating point before a lab result or an energy bill would tell you. Corrective recommendations arrive every 15 minutes, and only when the trend is actually out of bounds.
Reactive vs. proactive
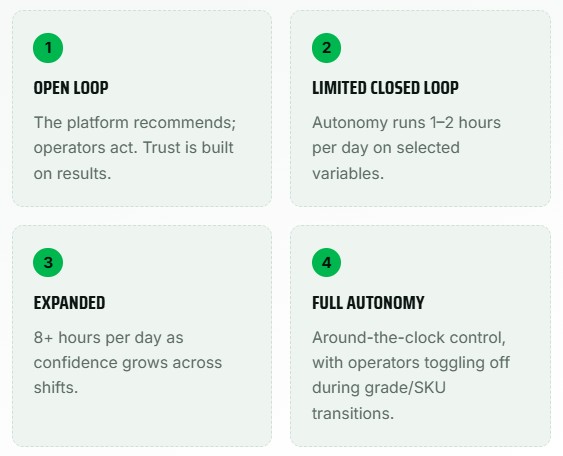
When your team is ready, the platform can write validated setpoint corrections back to the DCS itself, holding the efficient point around the clock without waiting on a person to act. Adoption is gradual and the operator stays in control: autonomy is toggled off during grade/SKU transitions and re-enabled after stabilization.
The adoption path
Measured results
Energy per ton falls as variability falls. These are the numbers from actual ProcessMiner deployments.
Figures reflect actual ProcessMiner deployments; the aeration share of energy budget is an industry benchmark for wastewater plants. Results vary by facility, process, and data quality; past performance is not a guarantee of future results.
See it on your energy load
We'll look at your historian data, identify where fixed-rate operation is outrunning demand, and decide together whether a pilot makes sense.
Already seen the platform in action? If you're ready to start a pilot, click below.
Get in touch
Whether it's our platform, your process, or a free in-depth process data analysis and pilot you'd like to see in action, let us know.