Lab cadence is too slow
Manual sampling and lab turnaround leave long blind spots between readings, exactly when a process is drifting toward the spec limit.


Your lab tells you what already happened. ProcessMiner predicts quality every 30 seconds, by grade, so your team can correct course before a deviation becomes scrap.
The problem with lab-based quality
Most quality checks happen after the fact: a sample pulled off the line, tested, and reported back minutes or hours later. That gap is where scrap, rework, and off-spec product get made. Operators are firefighters; they don't have time to optimize the process every 15 minutes on their own.
Manual sampling and lab turnaround leave long blind spots between readings, exactly when a process is drifting toward the spec limit.
Every product grade has its own quality limits. A single generic model can't keep up as production shifts from grade to grade throughout the shift.
Chasing an exact point value distracts from what matters: the direction the process is trending, and whether it's headed out of bounds.
How real-time quality prediction works
The model acts as a soft sensor. It learns your process from historical data, then predicts quality continuously, filling the gap between lab samples with a live, trend-based estimate that updates as conditions change. We focus on trend accuracy over point accuracy because that's what actually drives action: telling you the direction quality is moving well before a lab result would, not guessing a lab value to the decimal.
ProcessMiner predicts the trend and corrects in real time.
Inside the prediction engine
Real-time prediction isn't one model; it's a system that keeps testing, retraining, and adapting so the prediction in front of your team is always built on the best available fit.
Quality limits, upper, lower, and target, are defined per product grade. As production moves from one grade to the next, the platform applies the correct limits and model automatically, without a manual reset.
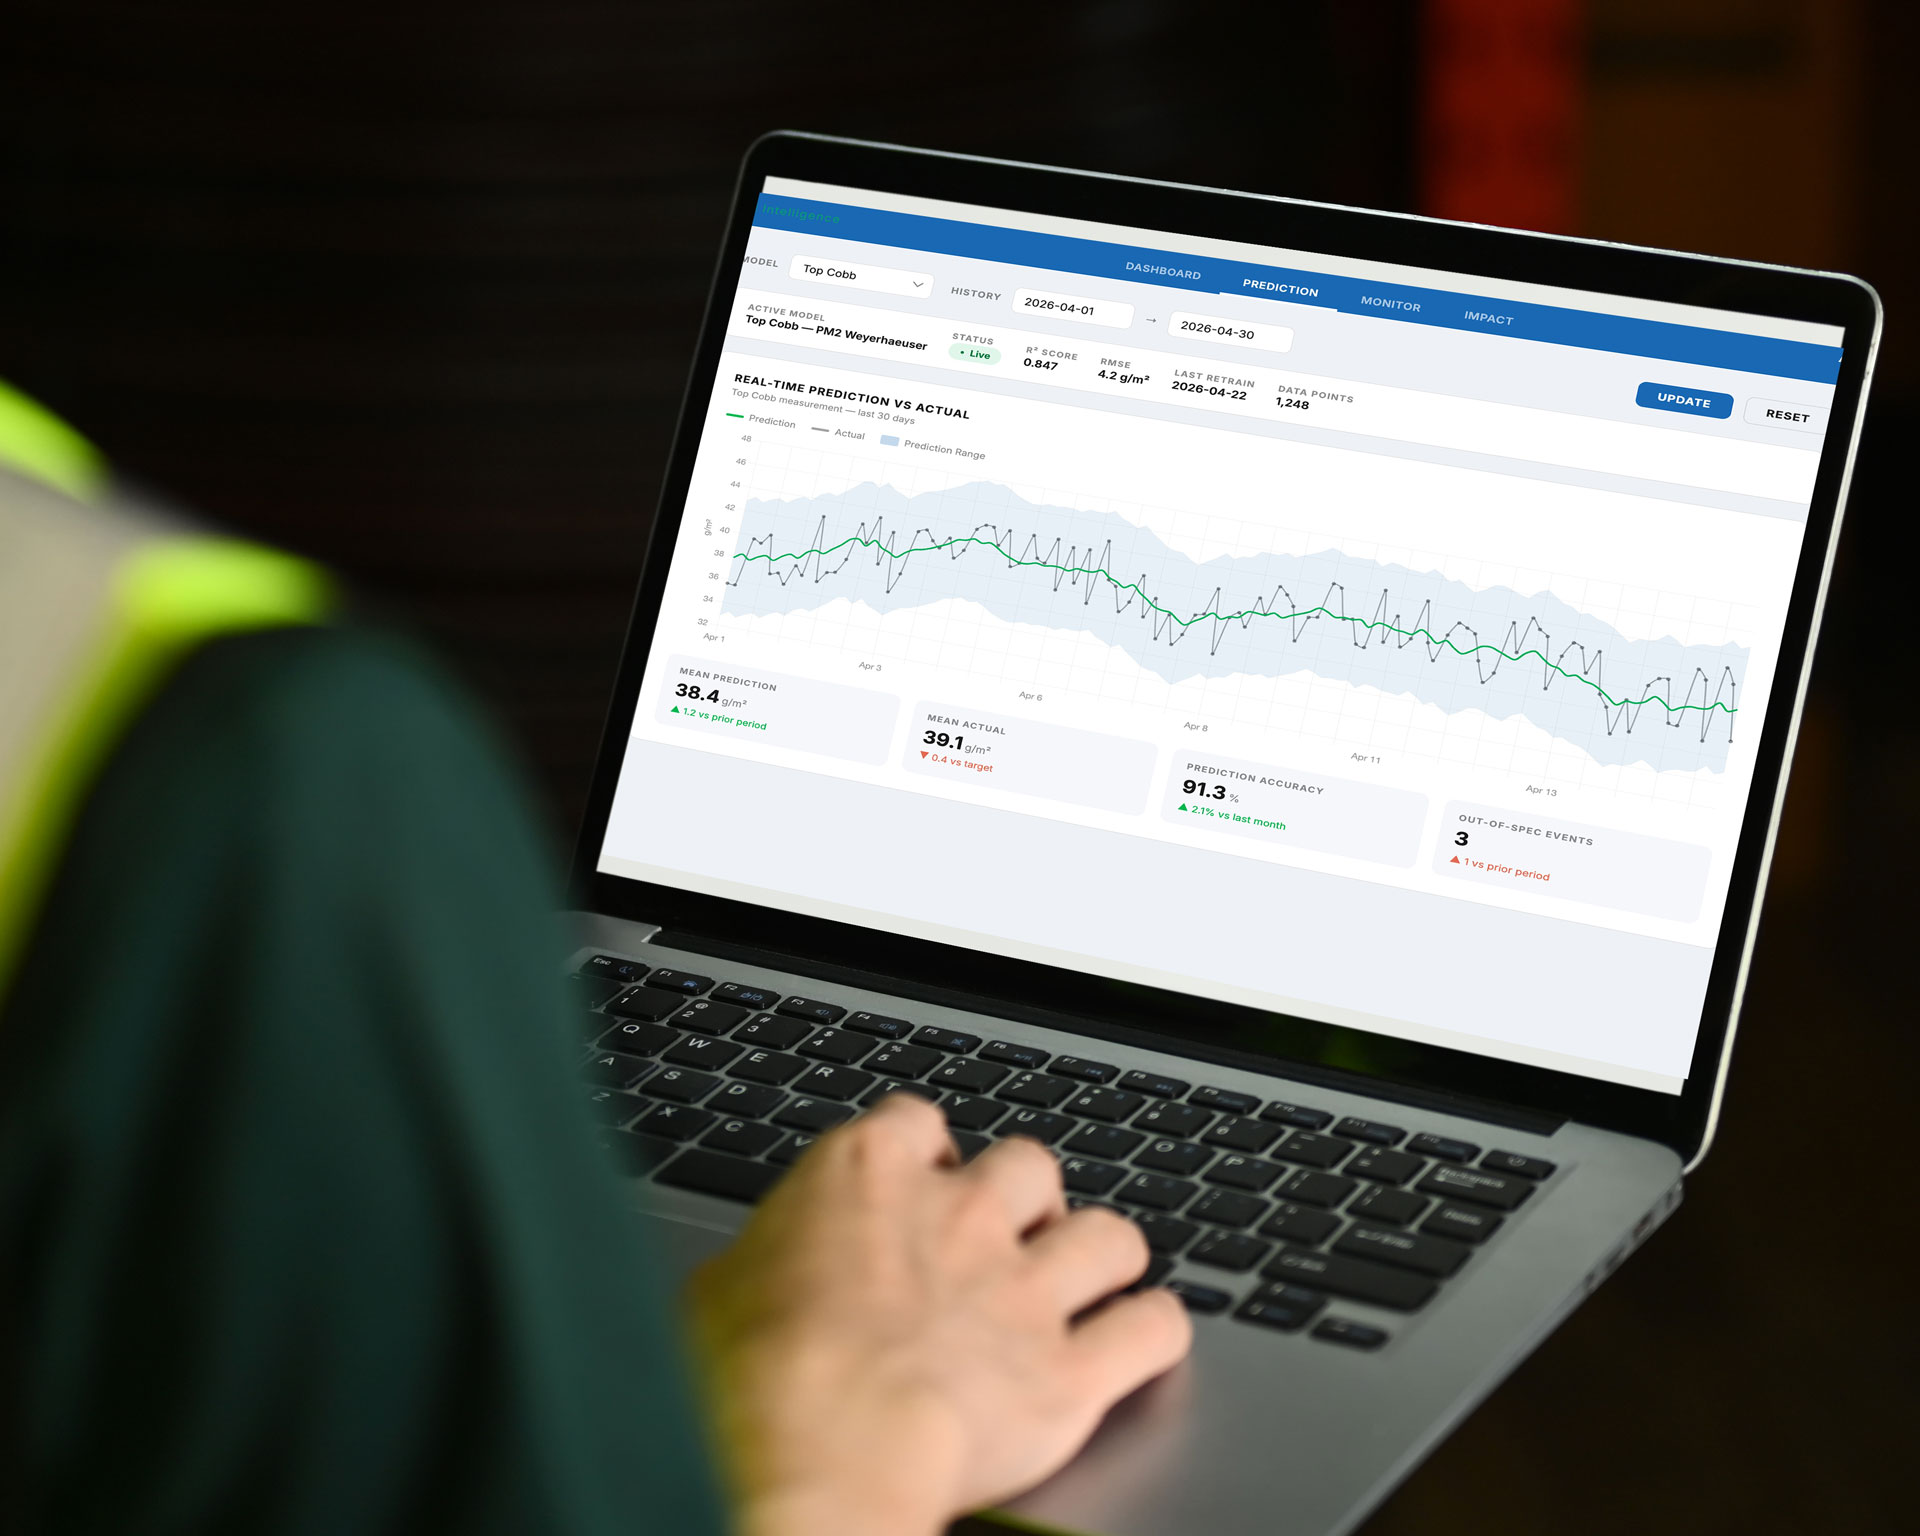
The platform tests hundreds of modeling approaches, from statistical regressions to random forest and deep-learning networks, and automatically switches methods when a model's performance degrades. You don't have to pick a technique or babysit a model.
Reactive vs. proactive
A prediction on its own tells you something is drifting. Paired with the rest of the platform, it tells your team what to do about it: setpoint guidance from Intelligent Centerlining, and a ranked list of contributing factors from root cause analysis.
Prediction feeds the platform
The Process Keeps Getting Better
"Every time a new lab result comes in, the model learns from it. That's what keeps a live prediction honest between tests, not just a guess running on a timer."
— Karim Pourak, CEO
Figures reflect actual ProcessMiner deployments in pulp and paper. Results vary by facility, process, and data quality; past performance is not a guarantee of future results.
See the prediction engine on your process
We'll walk through how the model would apply to your grades, your historian, and your quality metrics, then decide together whether a pilot makes sense.
Already seen the platform in action? If you're ready to start a pilot, click below.
Questions, answered
Quality predictions update every 30 seconds across every grade-specific parameter you are tracking. Corrective recommendations are issued every 15 minutes, and only when the process is trending out of bounds, not as a continuous stream of alerts.
We focus on trend accuracy because that is what actually drives action. The models are built to tell you where quality is heading, not to hit an exact lab value to the decimal.
The platform tests a vast library of hundreds of models, ranging from basic statistical linear regressions to advanced machine-learning and deep-learning neural networks, and automatically selects the best-performing model for your process.
The platform automatically picks the best model based on predefined performance criteria, and auto-switches to a different modeling method if performance degrades. If your domain experts have preferences for certain machines, grades, or mills, the selection criteria are fully adjustable.
Yes. The platform has built-in grade-transition logic that continuously adapts the model based on the active grade, and can manage anywhere from 5 to 40+ grades without manual reconfiguration.
A minimum of 6 months of historical data per quality metric, with 6 to 12 months preferred. That history is what the model uses to learn your process before it starts predicting live.
Get in touch
Whether it's our platform, your process, or a free in-depth process data analysis and pilot you'd like to see in action, let us know.