

In this post, we will learn about using a nonlinear correlation estimation function in R. We will also look at a few examples.
Background
Correlation estimations are commonly used in various data mining applications. In my experience, nonlinear correlations are quite common in various processes. Due to this, nonlinear models, such as SVM, are employed for regression, classification, etc. However, there are not many approaches to estimate nonlinear correlations between two variables.
Typically linear correlations are estimated. However, the data may have a nonlinear correlation but little to no linear correlation. In such cases, nonlinearly correlated variables are sometimes overlooked during data exploration or variable selection in high-dimensional data.
We have developed a new nonlinear correlation estimator:
nlcor
This estimator comes useful in data exploration and also variable selection for nonlinear predictive models, such as SVM.
Installing
To install
nlcor
> install.packages("devtools")2. Load the devtools package.
> library(devtools) 3. Install
nlcorfrom its GitHub repository by typing this in R console.
> install_github("ProcessMiner/nlcor")Nonlinear Correlation Estimator: Nlcor
In this package, we provide an implementation of a nonlinear correlation estimation method using an adaptive local linear correlation computation in
nlcorThe function
nlcorreturns the nonlinear correlation estimate, the corresponding adjusted p-value, and an optional plot visualizing the nonlinear relationships.
The correlation estimate will be between 0 and 1. The higher the value the more is the nonlinear correlation. Unlike linear correlations, a negative value is not valid here. Due to multiple local correlation computations, the net p-value of the correlation estimate is adjusted (to avoid false positives). The plot visualizes the local linear correlations.
In the following, we will show its usage with a few examples. In the given examples, the linear correlations between
xand
nlcoris small, however, there is a visible nonlinear correlation between them. This package contains the data for these examples and can be used for testing the package.
nlcorpackage has few sample
xand
yvectors that are demonstrated in the following examples.
First, we will load the package.
> library(nlcor)Example 1. A data with cyclic nonlinear correlation.
> plot(x1, y1)
The linear correlation of the data is,
> cor(x1, y1)
[1] 0.008001837
As expected, the correlation is close to zero. We estimate the nonlinear correlation using
nlcor> c <- nlcor(x1, y1, plt = T)
> c$cor.estimate
[1] 0.8688784
> c$adjusted.p.value
[1] 0
> print(c$cor.plot)
The plot shows the piecewise linear correlations present in the data.
Example 2. A data with non-uniform piecewise linear correlations.
> plot(x2, y2)
The linear correlation of the data is,
> cor(x2, y2)
[1] 0.828596
The linear correlation is quite high in this data. However, there is significant and higher nonlinear correlation present in the data. This data emulates the scenario where the correlation changes its direction after a point. Sometimes that change point is in the middle causing the linear correlation to be close to zero. Here we show an example when the change point is off-center to show that the implementation works in non-uniform cases.
We estimate the nonlinear correlation using
nlcor> c <- nlcor(x2, y2, plt = T)
> c$cor.estimate
[1] 0.897205
> c$adjusted.p.value
[1] 0
> print(c$cor.plot)
It is visible from the plot that
nlcorcould estimate the piecewise correlations in a non-uniform scenario. Also, the nonlinear correlation comes out to be higher than the linear correlation.
Example 3. A data with higher and multiple frequency variations.
> plot(x3, y3)
The linear correlation of the data is,
> cor(x3, y3)
[1] -0.1337304
The linear correlation is expectedly small, albeit not close to zero due to some linearity.
Here we show we can refine the granularity of the correlation computation.
Under default settings, the output of
nlcorwill be

> c <- nlcor(x3, y3, plt = T)
> c$cor.estimate
[1] 0.7090148
> c$adjusted.p.value
[1] 0
> print(c$cor.plot)
As can be seen in the figure,
nlcorcould identify the granular piecewise correlations. In this data, the p-value still remains extremely small—the correlation is statistically significant.
Summary
This package provides an implementation of an efficient heuristic to compute the nonlinear correlations between numeric vectors. The heuristic works by adaptively identifying multiple local regions of linear correlations to estimate the overall nonlinear correlation. Its usages are demonstrated here with few examples.
Related Articles

How a Plastic Injection Molding Manufacturer Reduced Scrap Rates by 25%
AI-powered Platform Delivers 25% Reduction in Scrap Rates

Artificial Intelligence Platform Achieves Unprecedented Autonomous Chemistry Control for Tissue Mill
The goal of this project was to autonomously control part of a tissue mill’s continuous manufacturing process using artificial intelligence and predictive analytics to reduce raw material consumption while maintaining the product quality with specification limit.
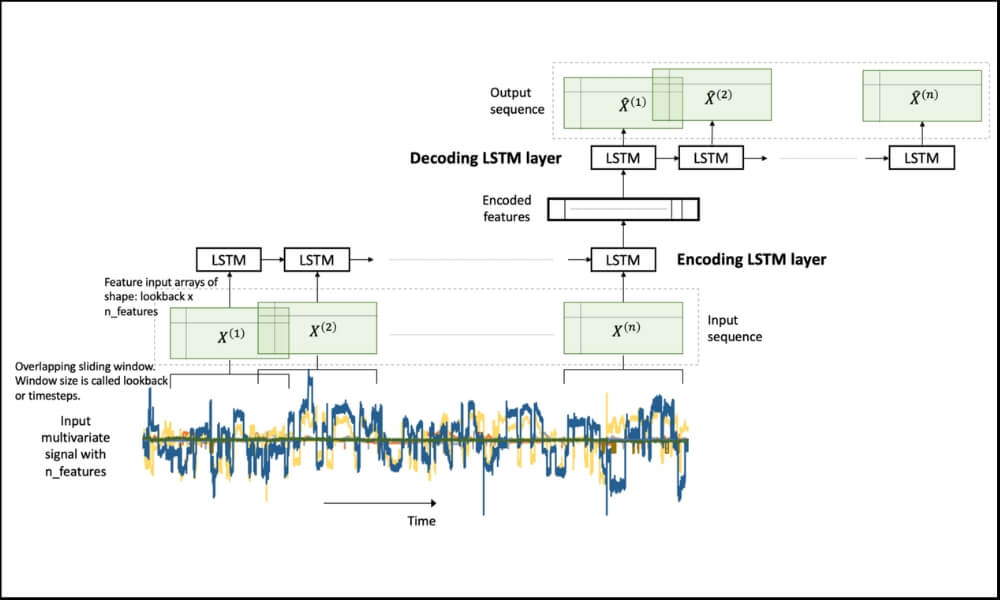
LSTM Autoencoder for Extreme Rare Event Classification in Keras
Here we will learn the details of data preparation for LSTM models, and build an LSTM Autoencoder for rare-event classification. This post is a continuation of my previous post-Extreme Rare Event Classification using Autoencoders. In the previous post, we talked about the challenges in an extremely rare event data with less than 1% positively labeled data.