

Researchers are often looking for interesting real-world problems. One major roadblock they face is real-world data. Here we are trying to serve the research community by providing a real-world problem and a dataset.
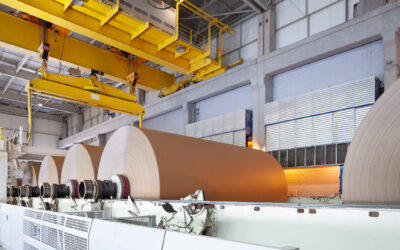
This dataset is created from the pulp-and-paper manufacturing industry. Paper manufacturing is a continuous process. A paper machine runs round-the-clock to continuously roll out reels of paper.
However, as smooth as we would like this process to be, we face paper breaks almost every day. Paper sheets are not the strongest material. Due to some adverse changes in process conditions, the paper sheet sometimes breaks (tears).
Whenever a break occurs, the whole machine is stopped. It takes typically more than an hour for the machine to restore. During this downtime, the mill loses more than $10k. Worse than this, an operator is often required to enter hazardous areas to inspect and restore the machine.
In the paper mills, we worked with, on average at least one break occurs every day. This is a major problem for these mills causing yearly losses in the order of millions of dollars and work hazards. Even a 5% reduction in the breaks will bring significant benefits to the mills.
We collected this break data with the purpose of building a model that can predict a break in advance. This can help mill operators prevent them. The key is to predict in advance with small false positives. In the following, we will explain the data and underlying challenges.
The dataset comes from a multivariate time series process. As mentioned before, the data contains a rare event of paper break that commonly occurs in the industry. Although a break happens every day, we still call it a rare event because…
We have high-frequency data measured every two minutes.
For one day, we will have 720 rows. If a break happens once, although the data will have approximately one hour of consecutive rows labeled as break, we will drop all the rows except the first one labeled as a break.
For example, if a break happened at time t and was there until time t+k, we drop rows for time (t+1):(t+k). This is part of data cleaning. As a result, we end up with only a few rows of positively labeled data.
The data contains sensor readings at regular time-intervals (x’s) of 2 mins and the event label (y). The primary purpose of the data is assumed to be building a classification model for early prediction of the rare event (you can think of any other approach). However, it can also be used for multivariate time series data exploration and building other supervised and unsupervised models.
A multivariate time series (MTS) is produced when multiple interconnected streams of data are recorded over time. They are commonly found in manufacturing processes that have several interconnected sensors collecting the data in overtime. In this problem, we have a similar multivariate time series data from a pulp-and-paper industry with a rare event associated with them. It is an unwanted event in the process — a paper break, in our case — that should be prevented. The objective of the problem is to
- Predict the event before it occurs, and
- Identify the variables that are expected to cause the event (in order to be able to prevent it)
A typical paper machine is several meters long that ingests raw materials at one end and produces reels of paper as shown in the picture. Several sensors are placed in different parts of the machine along its length and breadth. These sensors measure both raw materials (e.g. amount of pulp fiber, chemicals, etc.) and process variables (e.g. blade type, couch vacuum, rotor speed, etc.).
We encourage researchers to think of this problem. We have built a model for this data and have achieved an f1-score of 0.1. We had several researchers from top universities in the US and abroad work on this and share their results. At the time of publishing this, we are still at an f1-score of 0.1.
Related Articles
How Board Mill Optimizes Kymene Consumption
ProcessMiner Delivers 25% Reduction in Wet Strength Chemistry Usage
How Tissue & Towel Manufacturer Reduced Chemistry Use by 25%
ProcessMiner Delivers 25% Reduction in Wet Strength Chemistry Usage
How a Paper Board Mill Lowered Chemistry Dosage by 18%
ProcessMiner Delivers 25% Reduction in Wet Strength Chemistry Usage